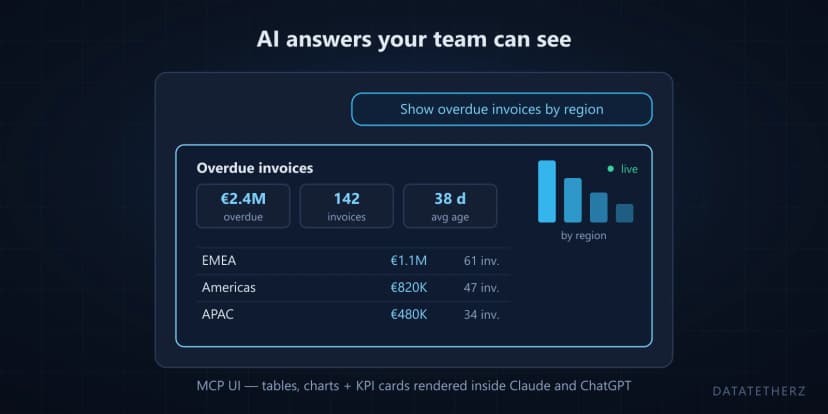
You've probably seen it happen: you ask Claude a question, and instead of a wall of text it builds a chart, a sortable table, or a small interactive app right there in the conversation. That's an artifact — and the first time you see it, it feels like the future of reporting arrived without a project plan.
For thinking out loud, it is genuinely great. But the moment a business wants to rely on one of those views — put it in front of a CFO, refresh it every Monday, trust the numbers — a few gaps show up. This post explains what artifacts are, where they stop being enough, and how a live report keeps what makes them useful while adding the parts a business actually needs.
What is a Claude artifact?
An artifact is a piece of interactive content Claude generates on the fly and renders in a live preview pane beside the chat: an HTML page, a React component, an SVG diagram, a chart, a little calculator. You can interact with it, edit it by asking, share it with a link, or download the source. Claude isn't fetching a pre-built template — it's writing the view in response to your specific prompt and rendering it in a sandbox.
Newer live artifacts go a step further: they can pull from data you've connected (through the Model Context Protocol) so the view reflects current numbers when you reopen it, rather than being frozen at the moment it was made. That's a real leap — and it's the same idea a live report is built on.
Where plain artifacts stop for a business
The strengths of artifacts are also their limits once other people depend on them:
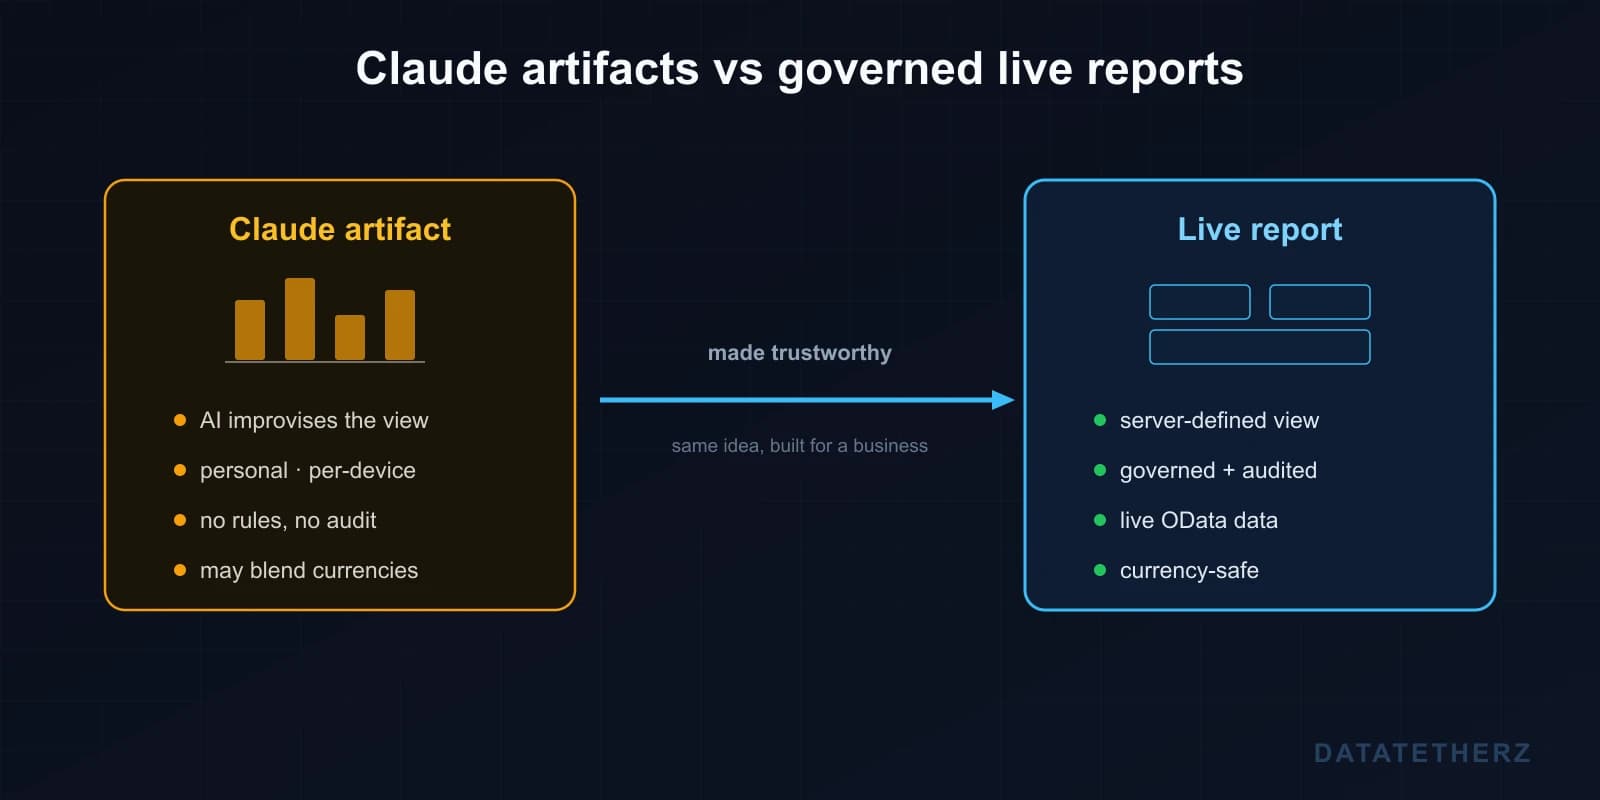
- The AI improvises the view each time. Ask a similar question tomorrow and you may get a different layout, different columns, a different chart type. Great for exploring; unnerving for a report people are supposed to recognize.
- They're personal. Artifacts generally live with one person, on their device and their plan. That's not a shared, governed reporting surface for a team.
- They don't know your rules. An artifact has no idea which fields are sensitive, which are off-limits, or that your revenue spans three currencies. It will happily add euros to dollars and hand you one confident, wrong KPI.
None of this is a flaw in artifacts — it's just the difference between a thinking tool and a system of record you can put your name against.
Live reports: the same idea, made trustworthy
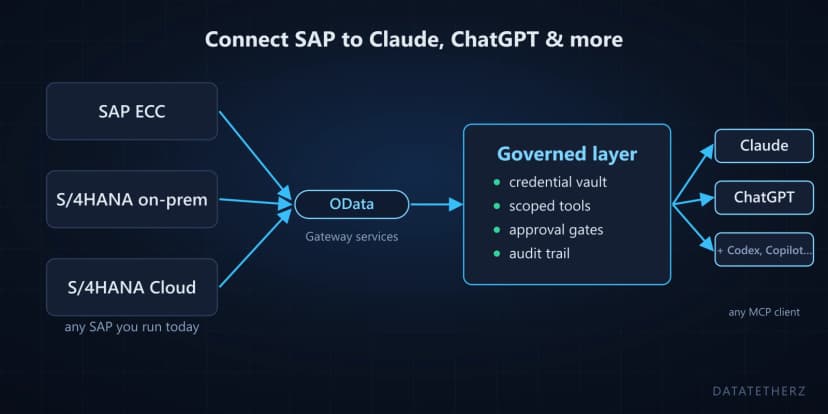
A live report in DataTether is that same in-chat, interactive view — but server-defined instead of improvised. It's a view the platform holds (an MCP UI resource), so it renders the same way every time, shows only the fields you exposed, pulls live data from your ERP at the moment you ask, and inherits every governance rule you've set: approval gates on any action, a full audit trail, and — the detail we're strict about — no silently blended currencies. A number a CFO might screenshot has to earn that trust.
In short: the AI still answers in plain language, but the presentation comes from the side that knows your data and your rules, not from the AI guessing.
The old way: building that report inside your ERP
To feel why this matters, compare it to how a report like that gets built today.
The traditional path runs through your ERP or BI stack — SAP Query, Report Painter, SAP BW, a Fiori app, or an extract into Power BI or Tableau. In practice that means: raise a ticket to IT, wait in a queue behind everyone else's requests, have someone model the data, then transport or deploy it — and by the time it lands, it's often reading a stale nightly extract. Every new variation ("same thing, but by region") is another ticket, another artifact for someone to maintain. Weeks, for a view somebody wanted this morning.
The live-report path collapses that. The person who actually knows the data — the SAP admin, the operations lead — drags a few widgets onto a grid, binds them to the OData connection you already made, and it's live in the chat in an afternoon. No ticket, no queue, no separate portal to log into, and it reads today's numbers instead of last night's.
To be fair: ERP and BI tools are powerful and still the right choice for heavy, pixel-perfect, statutory reporting. The work live reports win is the vast middle — the ad-hoc, "someone should really build a view for that" requests that never quite justified a project and so never got built.
How to build one
Building a live report is a drag-and-drop exercise, not a codebase:
- Drag the report together. Open the builder and drop widgets — table, KPI cards, chart, list, detail view — onto a responsive grid, or start from a template (executive, analytics, sales, operations).
- Point each widget at your data. Add a data-source alias mapped to one of your governed OData tools, then reference fields with simple bindings like
{{sales.NetAmount}}. Labels and formats come from the metadata you already configured.
- Save to publish. The report goes live on the same MCP endpoint your tools already use — no separate deploy.
- Ask. Anyone on the team asks the question in Claude or ChatGPT, and the live report renders right in the conversation.
No React project, no component-library decisions, no deploy pipeline for a dashboard. If you want the deeper concept behind the rendering, see what MCP UI is and the visuals on our MCP UI page.
The advantages, plainly
- Live, not stale — every open pulls current ERP data.
- Governed by default — only exposed fields appear; actions hit approval gates; everything is audited.
- Consistent — the same report, every time, for everyone.
- Currency-safe — mixed-currency totals are split or blocked, never blended into a wrong number.
- Built by the person who knows the data — not queued behind an engineering backlog.
- Lives where your team already works — inside the AI assistant they already have open, not a new portal to learn.
What it actually saves you
The cost story is the quiet headline. A live report means:
- No BI dashboard build and no reporting backlog — the request that would've become a two-week ticket becomes an afternoon.
- No analyst time per ad-hoc question — the view answers it, repeatedly, without a person in the loop each time.
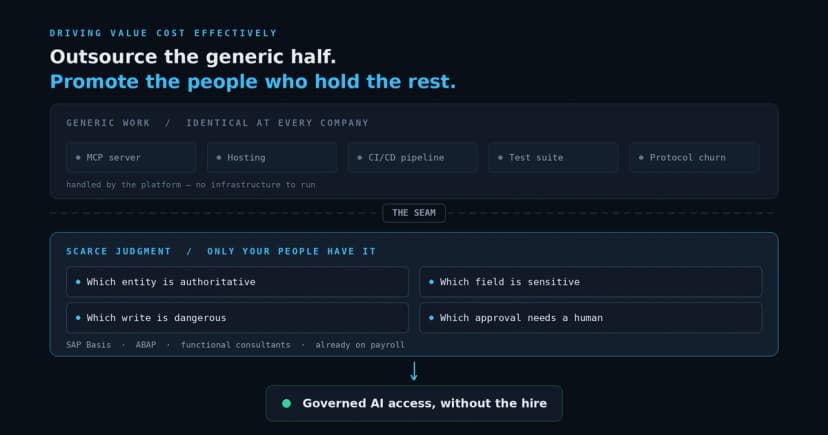
- No custom frontend or MCP server to build and maintain — that's real, recurring engineering cost most teams underestimate (we did the math).
- No new portal to license or train people on — it renders inside the assistant they already use.
The framing that matters: the report isn't a project you fund — it's the byproduct of a connection you already made.
Artifacts vs live reports at a glance
Artifacts showed everyone how good "AI that renders an answer" can feel. Live reports take that feeling and make it something a business can stand behind. If you'd like to see your own ERP data rendered as a governed, live report inside Claude or ChatGPT, request guided access — building the first one together takes about as long as reading this post did.

 cost
cost